Driving test pass rates by test centre
The pass rate and the number of car driving tests at all 57 RSA test centres in Ireland, from official figures.
Figures for Sep 2025 to Aug 2026
- All centres52.2%passed, of 267,043 tests
- Highest74.4%Clifden
- Lowest42.1%Carlow and Waterford
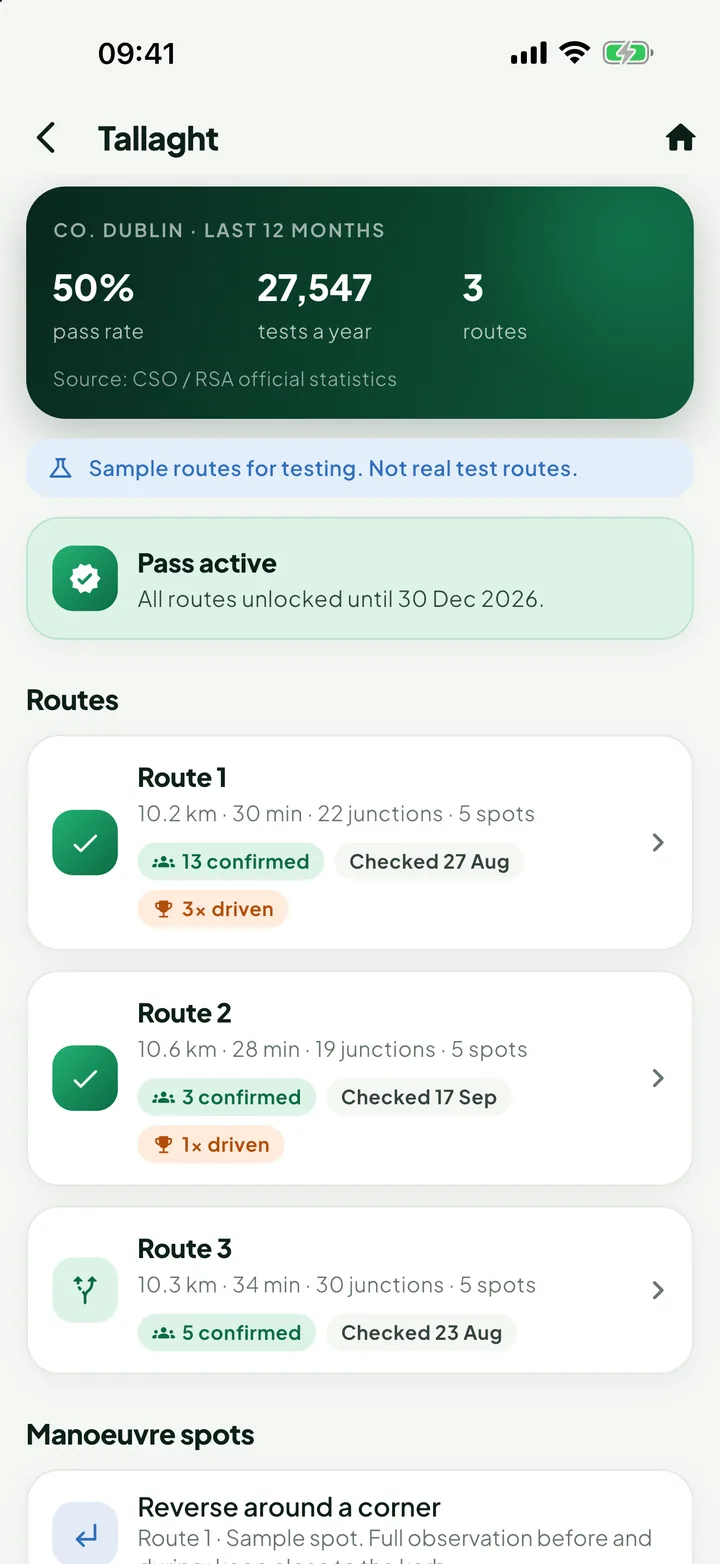
- Busiest27,547tests at Tallaght
All 57 test centres
Search for a town or county, or sort the list. Choose a test centre to see how it compares with the others.
| Test centre | Tests in 12 months | Pass rate |
|---|---|---|
| TallaghtCo. Dublin | 27,547 | 49.6% |
| Cork (Wilton)Co. Cork | 18,131 | 53.7% |
| Dún Laoghaire (Deansgrange)Co. Dublin | 16,585 | 47.8% |
| FinglasCo. Dublin | 15,601 | 45.0% |
| NaasCo. Kildare | 15,492 | 54.9% |
| NavanCo. Meath | 11,277 | 55.9% |
| DundalkCo. Louth | 8,591 | 55.6% |
| RahenyCo. Dublin | 7,917 | 50.0% |
| WaterfordCo. Waterford | 6,805 | 42.1% |
| MulhuddartCo. Dublin | 5,713 | 45.9% |
| Mallow (Cork Racecourse)Co. Cork | 5,206 | 51.4% |
| WexfordCo. Wexford | 4,665 | 46.4% |
| Limerick (Woodview)Co. Limerick | 4,595 | 58.4% |
| Limerick (Castlemungret)Co. Limerick | 4,434 | 56.3% |
| Galway (Clybaun Hotel)Co. Galway | 4,374 | 56.3% |
| Mulhuddart (Maple House)Co. Dublin | 4,216 | 47.0% |
| GoreyCo. Wexford | 4,111 | 55.1% |
| KillesterCo. Dublin | 4,067 | 48.0% |
| MullingarCo. Westmeath | 3,992 | 50.7% |
| WicklowCo. Wicklow | 3,835 | 47.1% |
| LetterkennyCo. Donegal | 3,745 | 59.1% |
| CavanCo. Cavan | 3,721 | 53.6% |
| Portlaoise (Maldron Hotel)Co. Laois | 3,651 | 57.0% |
| TraleeCo. Kerry | 3,613 | 54.5% |
| CastlebarCo. Mayo | 3,491 | 56.2% |
| AthloneCo. Westmeath | 3,469 | 46.3% |
| KillarneyCo. Kerry | 3,437 | 48.1% |
| SligoCo. Sligo | 3,309 | 52.0% |
| ClonmelCo. Tipperary | 3,259 | 50.6% |
| Galway (Carnmore)Co. Galway | 3,219 | 55.7% |
| Carlow (Talbot Hotel)Co. Carlow | 3,050 | 48.2% |
| TullamoreCo. Offaly | 3,043 | 52.8% |
| LoughreaCo. Galway | 3,004 | 65.0% |
| EnnisCo. Clare | 2,993 | 55.2% |
| SkibbereenCo. Cork | 2,923 | 55.6% |
| BirrCo. Offaly | 2,758 | 50.5% |
| Kilkenny (Government Buildings)Co. Kilkenny | 2,731 | 50.1% |
| TuamCo. Galway | 2,579 | 62.1% |
| CarlowCo. Carlow | 2,452 | 42.1% |
| RoscommonCo. Roscommon | 2,323 | 56.0% |
| DungarvanCo. Waterford | 2,230 | 54.4% |
| LongfordCo. Longford | 2,144 | 58.2% |
| DonegalCo. Donegal | 2,083 | 59.4% |
| Carrick-on-ShannonCo. Leitrim | 2,004 | 61.4% |
| MonaghanCo. Monaghan | 1,999 | 62.0% |
| Newcastle WestCo. Limerick | 1,842 | 67.2% |
| Drogheda (Southgate)Co. Louth | 1,740 | 54.2% |
| ThurlesCo. Tipperary | 1,740 | 66.0% |
| ShannonCo. Clare | 1,661 | 59.2% |
| Kilkenny (O'Loughlin Gaels)Co. Kilkenny | 1,643 | 50.4% |
| BallinaCo. Mayo | 1,470 | 56.2% |
| MitchelstownCo. Cork | 1,428 | 55.2% |
| BuncranaCo. Donegal | 1,342 | 62.9% |
| TipperaryCo. Tipperary | 1,319 | 55.9% |
| NenaghCo. Tipperary | 1,220 | 55.1% |
| KilrushCo. Clare | 794 | 59.3% |
| ClifdenCo. Galway | 460 | 74.4% |
Source: Central Statistics Office and RSA, Sep 2025 to Aug 2026. About these figures
How to read these figures
Where they come from
The figures are published by the Central Statistics Office, from RSA records. They cover car driving tests (category B) in the 12 months from Sep 2025 to Aug 2026.
What a pass rate tells you
It is the share of tests that were passed. It depends on many things, such as how ready the learners were and how busy the roads are. It does not tell you how your own test will go.
Small centres change more
A centre with few tests can go up or down a lot from one year to the next. Clifden, the smallest, had 460 tests in the 12 months.
Practise the roads around your test centre
PassRoutes guides you along routes near your test centre with spoken directions, worded the way a tester gives them. Route 1 at every test centre is free.
- Directions in your tester’s words
- Guides you back if you miss a turn
- Manoeuvre spots marked on the map
- Coming soon for iPhone on theApp Store
- Coming soon for Android on theGoogle Play
The app is coming soon. See how it works.